


Understanding National College Acceptance Rates
National Overview: The Big Picture
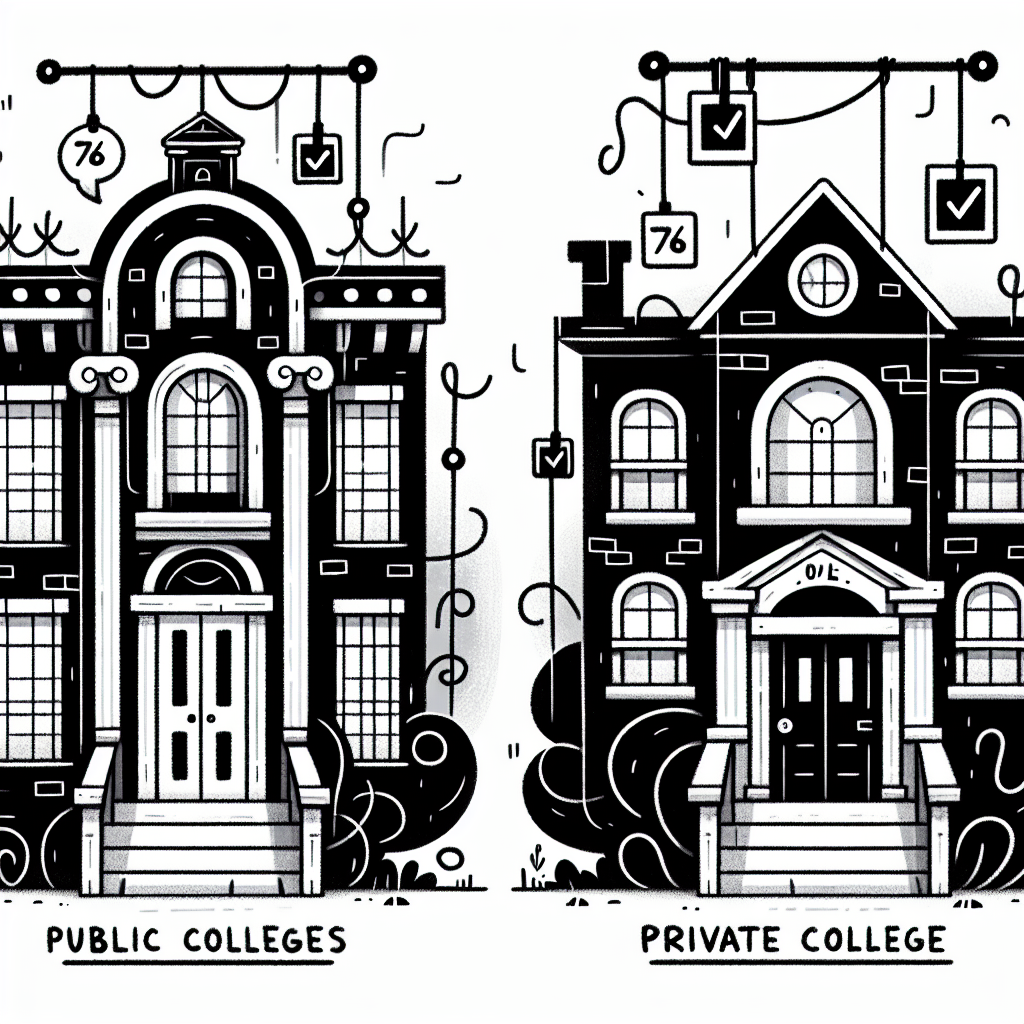
As of fall 2022, the average acceptance rate at U.S. four-year not-for-profit colleges was 73%, according to data from the National Association for College Admission Counseling (NACAC). Public colleges tended to be more accessible, with an average acceptance rate of 78%, compared to 70% at private colleges. These figures provide a broad look at college accessibility nationwide and are a core component of any college acceptance rates guide.
Public vs. Private Institutions
Digging deeper, the average acceptance rate at public four-year institutions stood at 65.1%, while private nonprofit four-year institutions had a much lower rate of 36.4% (NCES). Several factors contribute to this disparity:
- Funding Sources: Public colleges are typically state-funded and may have mandates to serve larger in-state student populations.
- Enrollment Strategies: Public schools often aim for higher enrollment numbers, while private institutions may prioritize smaller class sizes and selectivity.
- Institutional Mission: Private colleges may focus on specific academic strengths or missions, which can influence how selective they are.
These differences are important when using a college acceptance rates guide to evaluate potential schools.
Interpreting the 73% Average Acceptance Rate
While a 73% national average acceptance rate may seem high, it doesn’t capture the full picture. Elite institutions, such as Ivy League universities, often have acceptance rates below 10%, which drastically skews public perception.
Additionally, acceptance rates vary widely depending on:
- Region: Schools in densely populated or highly competitive states may have lower acceptance rates.
- Major: Competitive programs like engineering or nursing often have more selective admissions.
- Applicant Demographics: Factors such as residency status, socioeconomic background, and academic preparation can all influence individual chances of admission.
Using a college acceptance rates guide helps contextualize these variations, offering a clearer understanding of what the numbers really mean.
📈 Trends and Shifts in College Admissions
Recent Patterns from Fall 2022 Data
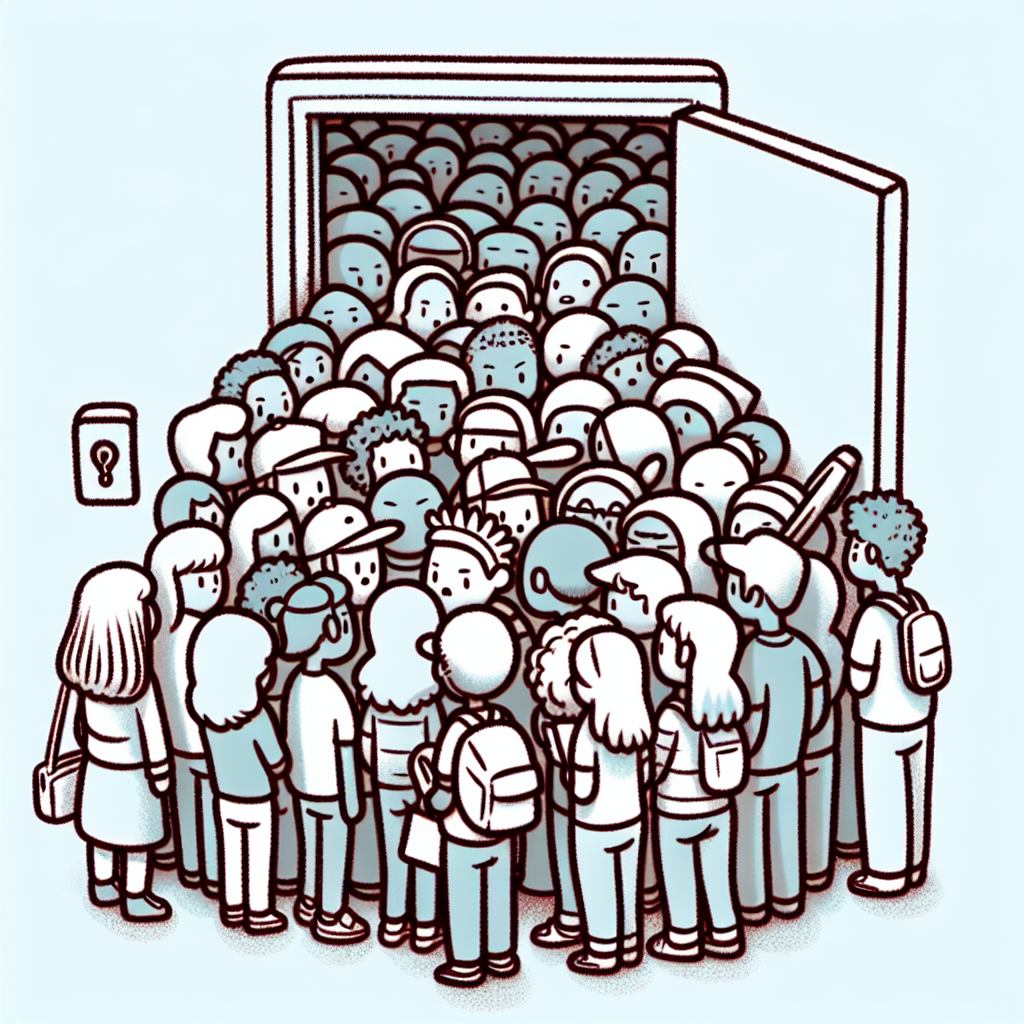
Recent data from Fall 2022 shows a steady increase in the number of applicants across all types of higher education institutions. This uptick in applications has led to a slight decline in overall acceptance rates at selective colleges. As more students submit applications to multiple schools, the competition for limited spots intensifies, particularly at top-tier institutions.
The Competitive Edge: Surge in Applications
Students are applying to more colleges than ever before, contributing to a surge in application volume. This trend is especially pronounced at highly selective schools, which have not significantly increased their class sizes despite the growing number of applications. As a result, acceptance rates at these institutions have dropped, making them more competitive (College Board). This dynamic is a core aspect of understanding the current college acceptance rates guide.
The Role of Test-Optional Policies
The adoption of SAT/ACT test-optional policies has further expanded applicant pools. By removing standardized testing as a requirement, more students feel encouraged to apply, including those who may not have considered certain schools previously. However, the impact of these policies on acceptance rates is complex and varies by institution. Some schools report little change in selectivity, while others have seen shifts in the composition and size of their applicant pools. This variability is an important consideration in any comprehensive college acceptance rates guide.
Strategic Planning for Applicants
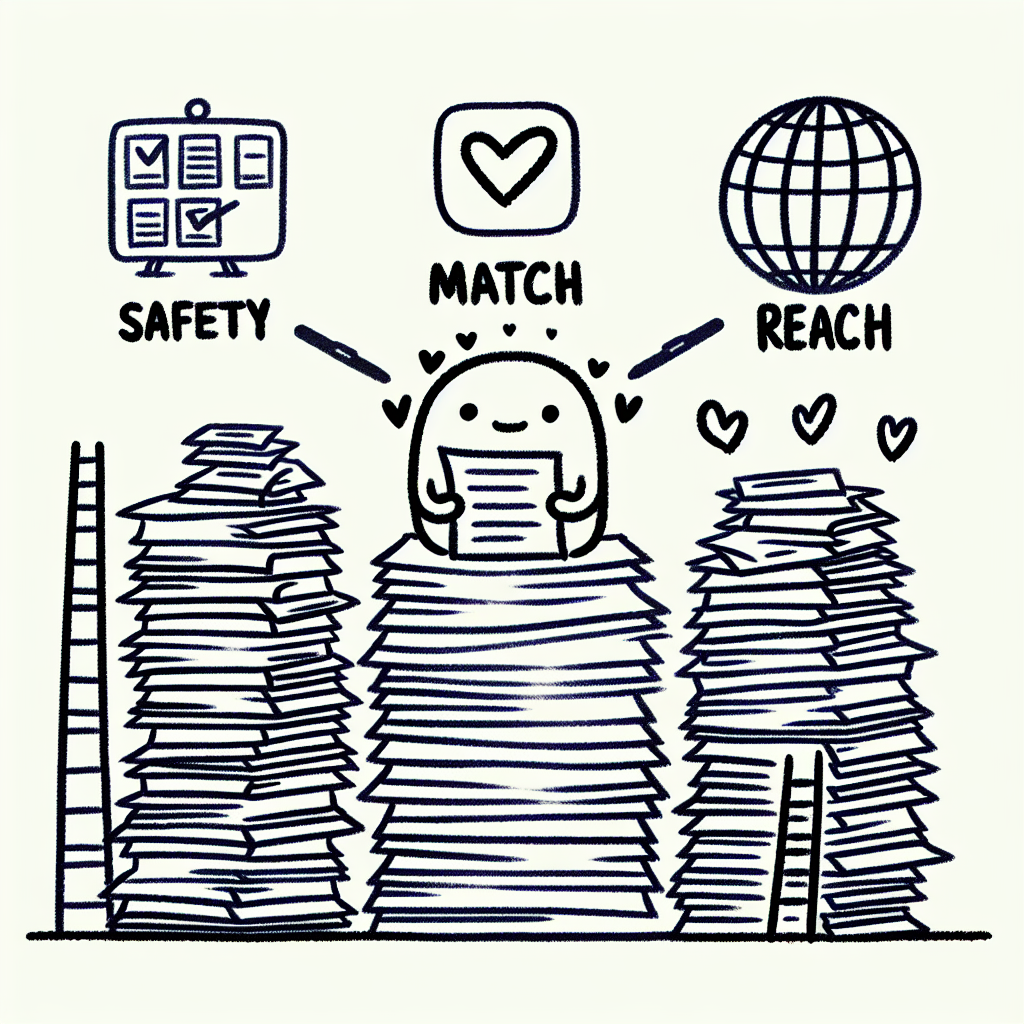
Applying Smart: Safety, Match, and Reach Schools
A key part of any college acceptance rates guide is understanding how to apply strategically. According to the College Board, students should apply to a mix of safety, match, and reach schools to maximize their chances of admission:
- Safety schools have higher acceptance rates and are institutions where your academic profile—such as GPA and test scores—exceeds the average admitted student's.
- Match schools are where your academic credentials closely align with those of the school’s typical admits.
- Reach schools are more selective, with lower acceptance rates and higher academic benchmarks. Even strong students may find admission to these institutions challenging.
Building a Balanced College List
Creating a well-rounded college list is essential in the college acceptance rates guide. A good rule of thumb is to apply to 2–3 safety schools, 3–4 match schools, and 2–3 reach schools. This approach helps ensure there are viable options regardless of how competitive the admissions cycle is. Use resources like the NACAC State of College Admission Report to access the most current data on acceptance trends and institutional selectivity.
Understanding Institutional Priorities
Another critical element in strategic planning is recognizing that colleges often have institutional priorities that can influence decisions beyond academics. These can include:
- Geographic diversity: Some schools seek a broad representation of students from different regions.
- First-generation applicants: Many institutions aim to support students who are the first in their families to attend college.
- Legacy status: Applicants with family alumni ties may receive additional consideration.
- Demonstrated interest: Visiting campuses, attending info sessions, or communicating with admissions counselors can positively impact your application.
These factors can play a role in how college acceptance rates guide decision-making, so it's important to consider them when finalizing your college list.
🧠 Key Influences on Acceptance Rates
Acceptance rates are shaped by several interconnected factors. Understanding these can provide valuable insight for anyone consulting a college acceptance rates guide.
Institutional Selectivity and Mission
Colleges and universities vary significantly in their missions, which directly affects how selective they are. Research universities often have lower acceptance rates than liberal arts colleges due to their emphasis on graduate programs, faculty research, and large-scale funding. Liberal arts colleges, in contrast, typically focus on undergraduate teaching, which can lead to different admissions priorities.
Additionally, private institutions tend to have greater flexibility in admissions decisions because they are not bound by state funding requirements. Public universities, on the other hand, may prioritize in-state applicants to meet legislative mandates or funding expectations, influencing their acceptance rates accordingly.
Enrollment Goals
Colleges aim to admit a class that meets both academic standards and institutional needs. A key metric in this process is yield—the percentage of admitted students who choose to enroll. To manage yield effectively, institutions may use waitlists or adopt rolling admissions strategies. Waitlists allow colleges to fill gaps after initial acceptances are declined, while rolling admissions enable them to assess candidates continuously and adjust acceptance rates throughout the admission cycle.
Economic and Social Trends
Macroeconomic conditions and demographic patterns also influence acceptance rates. Rising tuition costs often push families to consider financial aid availability more heavily, prompting schools to adjust admissions strategies based on their aid budgets. Furthermore, shifts in the number of U.S. high school graduates—such as regional declines in student populations—can force colleges to expand recruitment efforts or alter selectivity to maintain enrollment numbers.
These elements, taken together, explain why acceptance rates vary from year to year and across institutions. They are essential to grasp for anyone reading a college acceptance rates guide.

🧰 Tools and Resources for Navigating Admissions
To make sense of the ever-changing landscape outlined in this college acceptance rates guide, students and families can utilize a variety of tools and resources that provide critical insights and support.
Essential Data Sources
Accurate, up-to-date data is key when researching acceptance trends and institutional profiles:
- The NACAC College Admission Trends Tool offers nationwide insights into the factors colleges prioritize during admissions, helping applicants understand how their profile aligns with current trends.
- The NCES College Navigator, maintained by the U.S. Department of Education, provides comprehensive data on college enrollment, tuition, graduation rates, and acceptance rates.
- College Board Big Future allows students to explore colleges based on admission requirements, majors, and financial aid, offering tools to assess admission likelihood.
Interactive Tools for Applicants
In addition to databases, interactive tools can help students make informed choices:
- GPA calculators and scattergrams visualize how individual academic profiles compare to accepted applicants at various institutions.
- Net price calculators estimate the actual cost of attendance after financial aid, which is critical for planning.
- College match and comparison platforms allow users to input preferences and academic data to generate a tailored list of schools aligned with their goals and the realities of college acceptance rates.
These tools support strategic decision-making throughout the college application process, grounding choices in the data-driven context presented in this college acceptance rates guide.

Final Thoughts: Making Informed Decisions
One of the key takeaways from this college acceptance rates guide is that low acceptance rates should not be a source of fear. Instead, they highlight the importance of strategic planning. By carefully researching schools, crafting strong applications, and applying to a balanced list of institutions, students can significantly improve their chances of admission.
While prestige often draws attention, the best choice is one that fits a student’s academic goals, personal interests, and long-term aspirations. A college that aligns with a student’s values and needs is far more likely to support their success than one chosen solely for its ranking.
Using reliable data and seeking expert guidance—whether from school counselors, admissions professionals, or trusted resources—can help students and families navigate the admissions process with greater confidence. Making informed choices leads to better outcomes, even in a competitive landscape.
 SHARE ON FACEBOOK
 SHARE ON TWITTER


